 Statement of Work
Using Maps and Technology to Increase Report Readability
Guzi-West is pushing the envelope to develop new ways of presenting the information we capture from our assessments.
We conduct detailed mold investigations using state of the art technology. This technology helps to discover the presence of mold and quantify the severity of a problem.
Throughout the inspection, lots of data is generated, including atmospheric readings, moisture readings, infrared imagery, and sample attributes. After an investigation, that information is condensed into a formal report to outline our findings. Thanks in part to Guzi-West’s increasing GIS Resources, we can take it a step further, creating maps to show the data in a visual format. Presenting information as a map as opposed to a table simplifies readability. The specifications of an investigation can determine what type of map is a good fit.
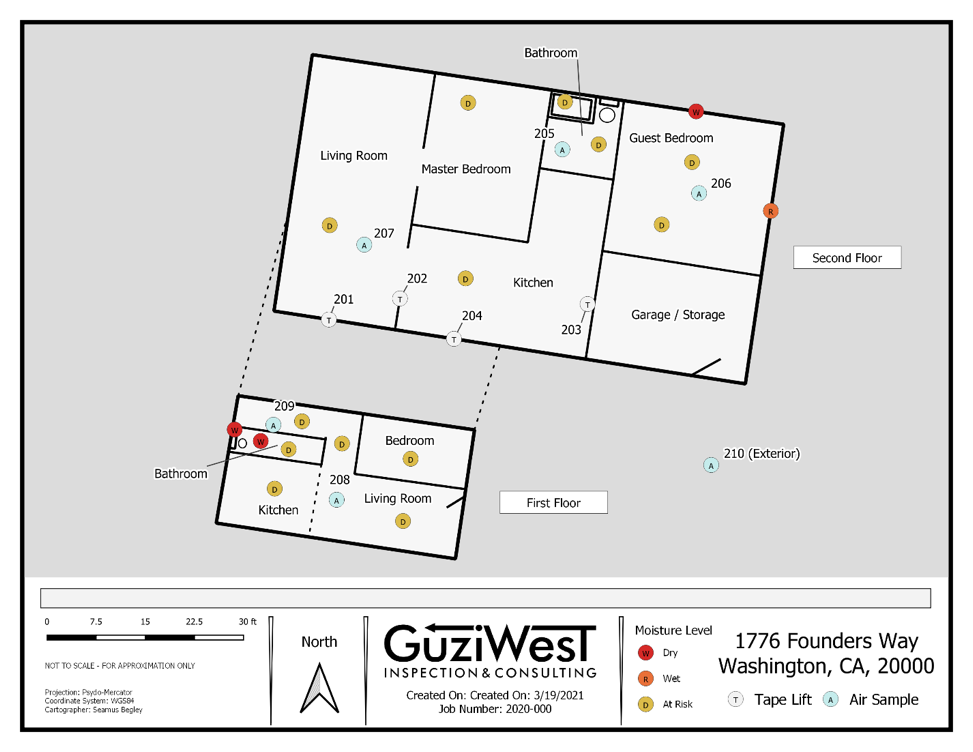
Every mold investigation map starts with a building outline, delineating interior areas and relevant features. Atmospheric readings (temp, humidity) are included as a label along with the room name. Sample locations are added in as points and stylized to their respective type: air samples, tape lifts, and moisture readings.
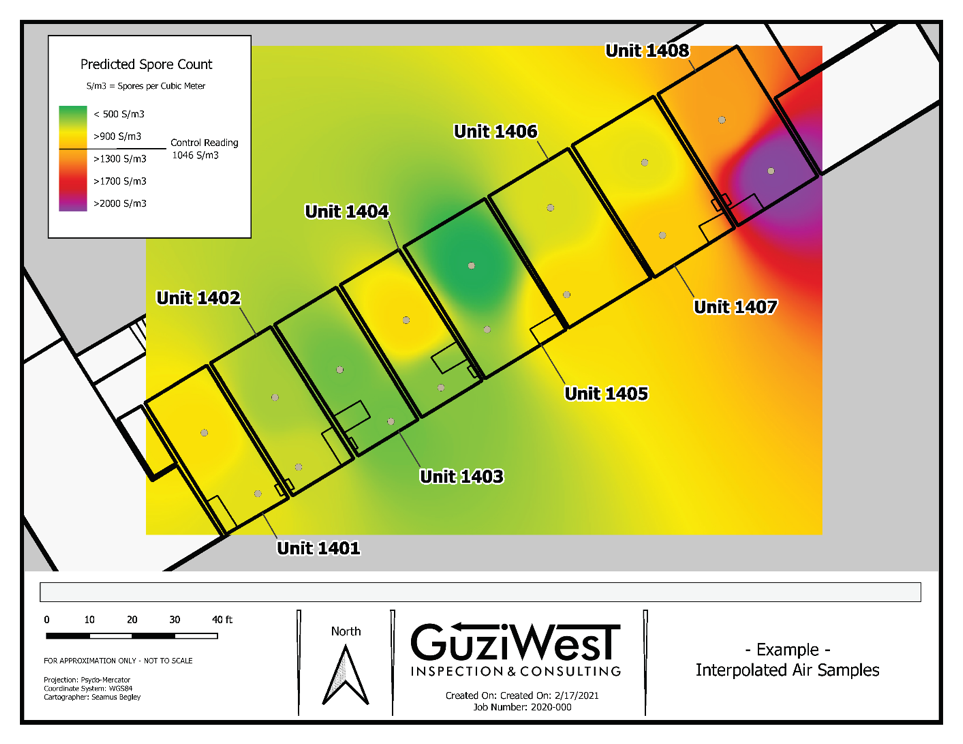
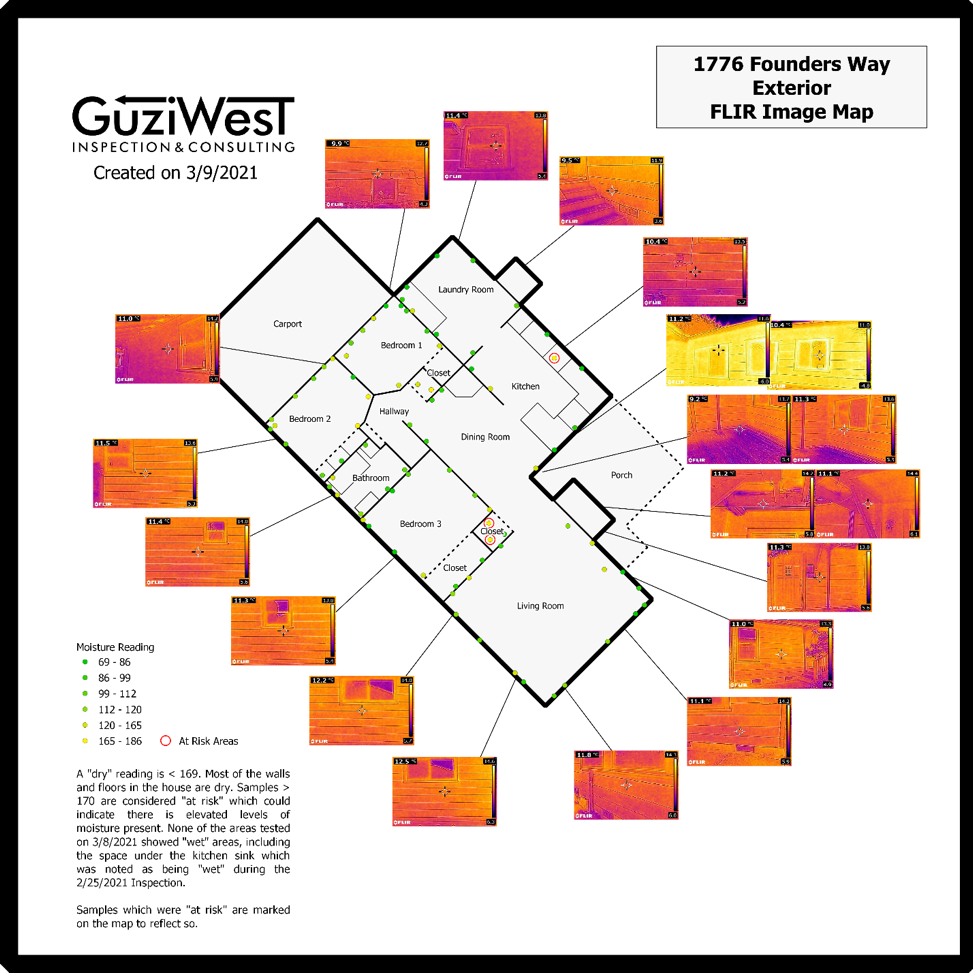
Depending on the project scope, moisture samples may be stylized based on their qualitative differences (Wet, At-Risk, or Dry – See Map 1), or quantitative value, represented by a sliding scale between 1 to 999, where 1 represents a dry area, and 999 represents a very wet area. Quantitative maps are outfitted with a discrete scale separated by natural breaks, showing the scale of readings relative to the max and minimum values of the project (See Map 3). In an advanced case, we can create a map with interpolated values, generating a continuous picture, estimating where moisture levels will be based on nearby points (See Map 2). Another advanced map offering, involves a map as mentioned above, with the addition of embedded FLIR imagery so moisture results can be easily interpreted (See Map 3).
Guzi-West makes a map for every mold investigation. Every map we make is different! Each one tells the story of an investigation and makes interpreting the results a little bit easier. We’re committed to providing the best experience for our customers and we are always striving to make improvements to meet that goal. If you think a particular type of map would be the best fit for your investigation, please reach out to the Guzi-West team to inquire about the possibilities.